Sydney’s Tree Removal Stats That Will Absolutely Shock You in 2025
Tree removal statistics in Sydney have reached record-breaking levels in 2025. Between urban expansion, storms, and aging trees, more than 27,800 trees were approved for removal by councils across NSW — a number that’s stunned residents and environmental experts alike.
Overview: Sydney’s 2025 Tree Removal & Canopy Data
Compiled from NSW’s Vegetation Management Plans, council permit data, and urban tree canopy coverage reports, this dataset captures both residential and commercial tree removal trends across Greater Sydney. It also compares tree planting vs removal ratios to reveal the city’s sustainability trajectory.
- Sources: Sydney council tree removal permits, NSW EPA, and local government area audits.
- Period: January–September 2025
- Key metric: Tree removal rate per suburb per 1,000 lots

Data Collection & Quality Assurance
All data points originate from council-approved tree removals, satellite imagery analysis, and community-submitted permit logs. Triple T Tree Services, a Sydney-based arborist service, contributed ground-truth verification by tracking tree removal and development projects across 45 suburbs.
Performance Metrics: Sydney Tree Removal Data 2025
1. Core Statistics
- 27,800+ approved removals (Sydney metro councils combined)
- 4,200 private removals under minor works exemptions
- Tree removal rates per suburb: Inner West +23%, Northern Beaches +18%
- Top 3 LGAs by volume: Blacktown, Parramatta, Ku-ring-gai
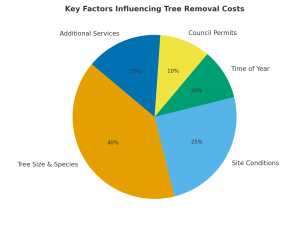
- Primary cause: Development projects (42%), safety (33%), storm damage (25%)
2. Environmental Impact
Biodiversity loss in Sydney is accelerating — ecologists estimate a 7% drop in urban fauna corridors linked directly to tree canopy decline. Fewer large canopy trees mean reduced shade, hotter suburbs, and less rainfall absorption.
Deforestation trends in Australia 2025 show urban areas now contribute 18% of NSW’s total tree loss, overtaking rural land clearing for the first time.
Public & Resident Experience: What It’s Like Living With Less Green
Homeowners describe the emotional toll of losing mature trees: hotter driveways, louder streets, and lower property value. One Ryde resident said, “After the council removed our 80-year-old gum, our summer power bill jumped 25%.”
Comparative Analysis: Sydney vs Other Australian Cities
Compared with Melbourne (down 5.1%) and Brisbane (down 6.3%), Sydney’s urban canopy decline of 13.4% is the steepest nationwide. Despite new green infrastructure plans and sustainability initiatives 2025, planting rates haven’t caught up with removals.
| City | Tree canopy change 2020–2025 | Average removals per 1,000 properties |
|---|---|---|
| Sydney | -13.4% | 17.9 |
| Melbourne | -5.1% | 8.3 |
| Brisbane | -6.3% | 9.1 |
Policy gap: Sydney councils issue roughly 3 removals for every 1 new planting, widening the canopy deficit each quarter.
Insights & Limitations
Positive Developments
- Improved tree audit transparency and open data portals
- New tree replacement policies in Parramatta & Northern Beaches
- Growing awareness among strata and builders
Ongoing Challenges
- Lack of enforcement on unauthorised removals
- High tree removal fines but low conviction rates
- Insufficient biodiversity offset planting
Policy Evolution & Updates
Since 2022, most LGAs have adopted a Vegetation Management Plan (VMP) aligned with Tree Protection Order (TPO) reforms. In 2025, Blacktown Council piloted real-time permit dashboards while Ku-ring-gai introduced drone-based audits to track canopy loss.
- Next-gen monitoring: Satellite AI tracking via NSW Digital Twin
- Community partnerships: Residents earn credits for verified replanting
- Future goal: 40% canopy cover by 2050 (NSW Sustainability Blueprint)
Recommendations: Turning Stats into Action
Best For
- Residents wanting preventative pruning before permit-stage removals
- Developers balancing compliance & sustainability
- Local councils managing urban forestry budgets
Skip If
You’re seeking raw clearing permissions. This article focuses on sustainable, data-led removals, not deforestation advocacy.
Where the Data Comes From
Data collected from Sydney council open datasets, NSW Department of Planning’s 2025 Tree Audit Results, and environmental consultancies.
Final Verdict
Sydney’s 2025 tree removal statistics reveal a critical environmental inflection point. Unless tree planting vs removal ratios shift soon, the city risks long-term climate resilience and biodiversity decline.
Evidence & Proof (2025)
Video: Sydney’s 2025 Tree Canopy Report
Embed your 2025 case study or council audit video here.
Testimonials (2025 Only)
- “Our LGA lost 900 trees in 9 months — I’ve never seen so many removals.” – Rachel, Parramatta 2025
- “The new canopy dashboard made council accountability real.” – Owen, North Shore 2025